
Ceramic Fiber Filter Performance & Test Reports
How to Read These Numbers — Notes From Our Test Lab
Every figure on this page is stated with its operating envelope, because a performance number without conditions is a sales claim, not engineering data. Filtration precision of 1 μm and >99.9% dust removal hold at a surface filtration velocity of 2–5 cm/s with pulse-jet cleaning at 0.4–0.7 MPa. The 300 Pa clean pressure drop is measured at 1 m/min face velocity with no dust; design your system around 900–1,500 Pa total operating resistance (900–1,300 Pa typical in glass furnace duty). The 600°C continuous rating (1,000°C peak) assumes chemical exposure within stated limits — HF below 5 ppm and no phosphoric acid vapor. If your operating point sits outside any of these conditions, the honest answer is that the headline numbers change; send us your data and we will tell you what to expect instead.
Key Performance Specifications
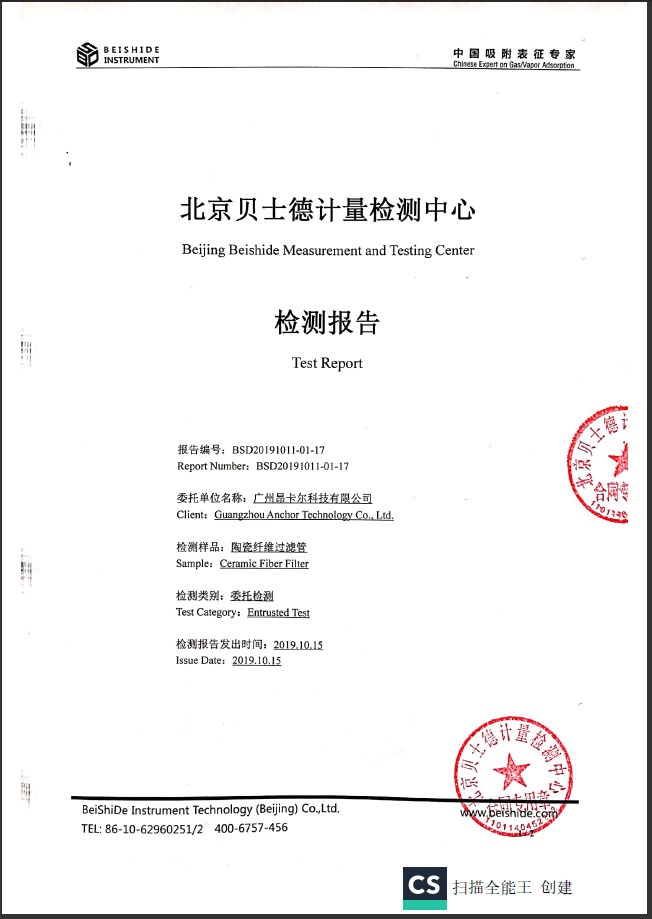
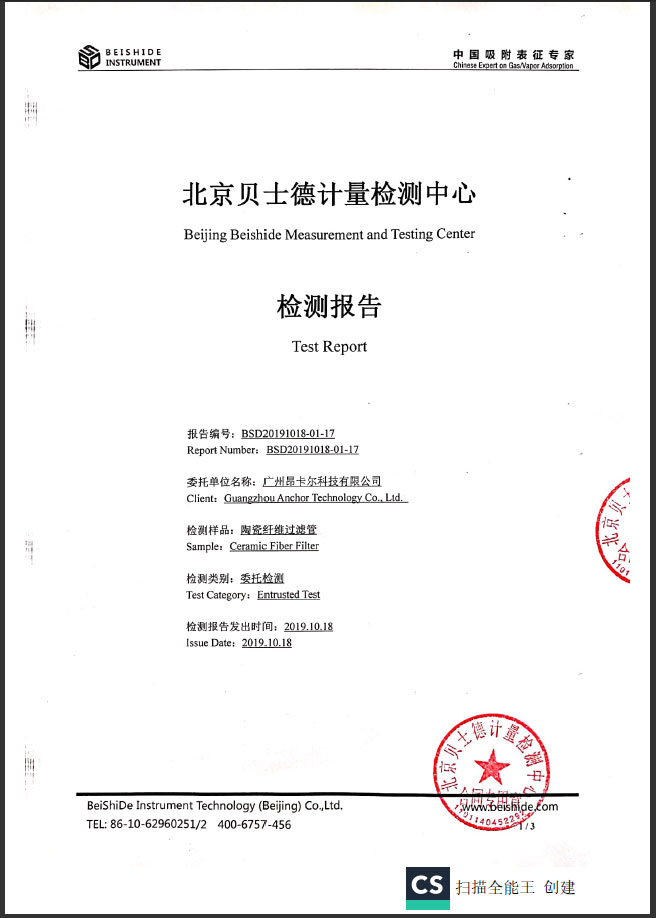
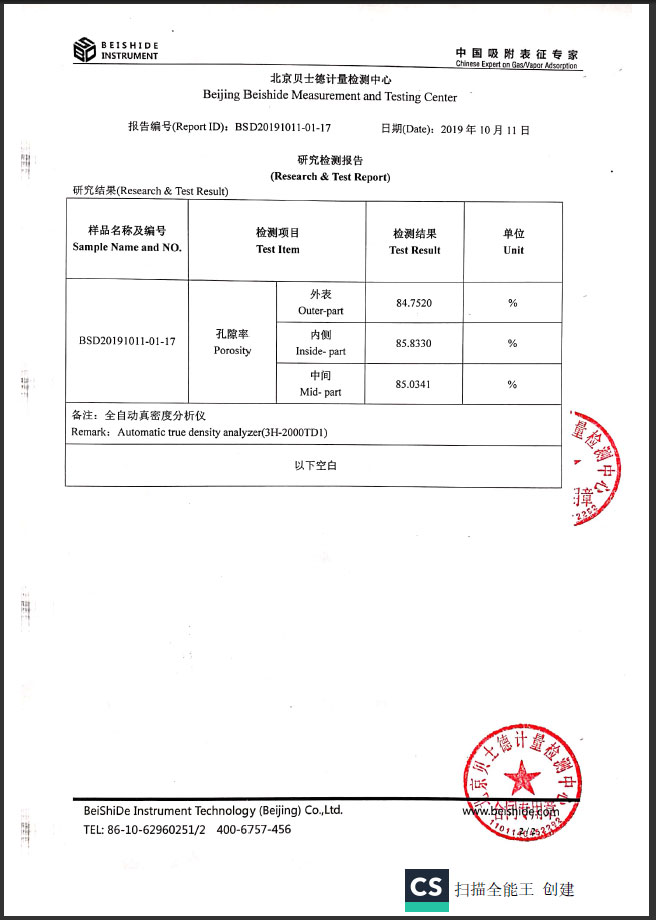
Anchor Technology ceramic fiber filter tubes are engineered for reliable, long-life hot gas filtration in demanding industrial environments. The specifications below are verified by the independent porosity and pore-diameter test reports shown above.
- Dust removal efficiency: > 99.9%
- Residual dust after dedusting: < 5 mg/Nm³
- Operating temperature: up to 600°C continuous, 1000°C maximum
- Service life: more than 5 years, backed by a 5-year written warranty
- Corrosion resistance: acid and alkali resistant
Model & Dimensions
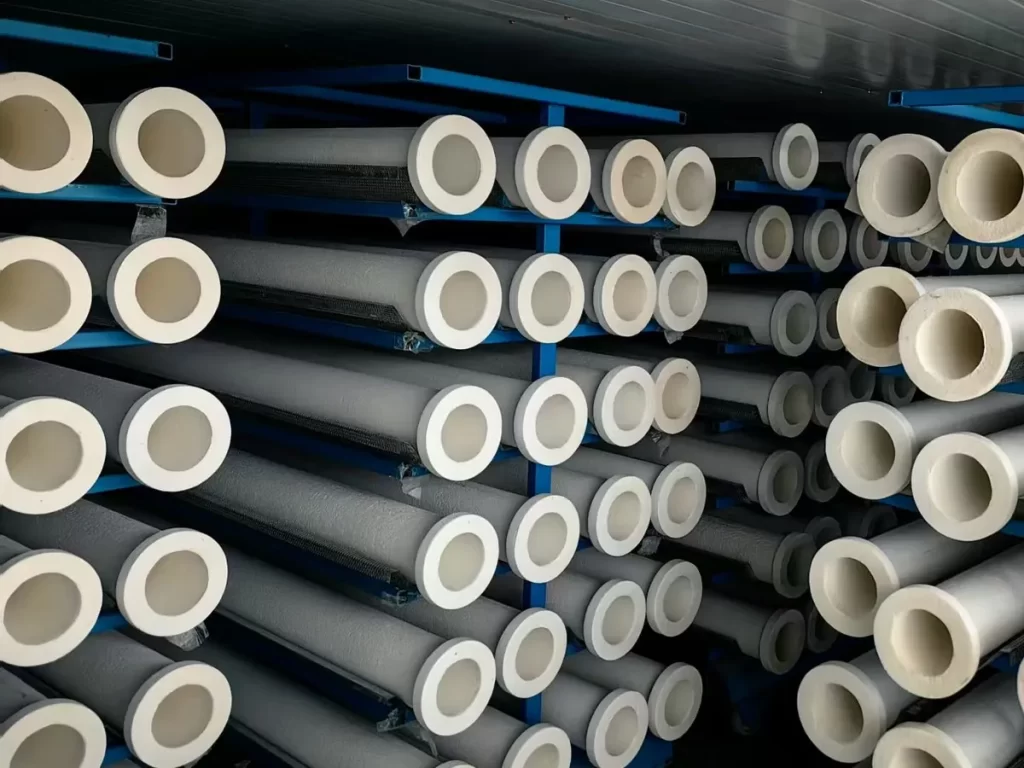
Both the non-catalyst and catalytic filter lines are produced in the same AW model range, covering lengths from 300 mm to 3000 mm and a wide choice of inner diameters, flanges and surface areas.
| Model | Length (A) mm | Inner Ø (B) mm | Outer Ø (C) mm | Flange Ø (D) mm | Flange Thk (E) mm | Flange Shape (F) | Surface Area (G) m² | Weight (H) kg |
|---|---|---|---|---|---|---|---|---|
| AW300 | 300 | 110 | 150 | 190 | 30 | T | 0.1 | 1.3 |
| AW500 | 500 | 40 | 60 | 80 | 20 | T | 0.2 | 0.4 |
| AW1000-A | 1000 | 40 | 60 | 80 | 20 | T | 0.2 | 0.65 |
| AW1000-B | 1000 | 110 | 150 | 195 | 30 | T | 0.48 | 3.2 |
| AW1500-A | 1500 | 40 | 60 | 80 | 20 | T | 0.28 | 0.9 |
| AW1500-B | 1500 | 110 | 150 | 195 | 30 | T | 0.7 | 4.5 |
| AW2000 | 2000 | 120 | 150 | 195 | 30 | T | 1 | 5 |
| AW1950 | 1950 | 120 | 150 | 200 | 65 | Y | 1 | 5 |
| AW2400 | 2400 | 80 | 120 | 160 | 30 | T | 0.9 | 5.5 |
| AW3000-A | 3000 | 120 | 150 | 195 | 30 | T | 1.4 | 7.5 |
| AW3000-B | 3000 | 110 | 150 | 195 | 30 | T | 1.4 | 8.5 |
Remark: It is normal for the actual product dimensions to differ slightly from the table above. Please contact our technical support for the specific tolerance range.
Filtration Performance & Test Reports
The test reports above document porosity and pore-diameter distribution – the two parameters that determine filtration accuracy and pressure drop. These values apply to the standard non-catalyst ceramic fiber filter. For integrated desulfurization and denitrification, see the catalytic ceramic fiber filter.
Need detailed datasheets or full test reports? Contact us and our engineers will provide the complete documentation.
What We Have Seen in the Field: Three Failure Modes and How to Avoid Them
Across 40 installations since 2019, nearly every premature performance problem traces back to one of three causes. Thermal shock — temperature swings faster than 200°C per minute — is managed with warm-up sequences and, in batch processes, a modified installation layout. Acid dew point condensation during cold starts is prevented with insulation, trace heating, or a bypass sequence; this is a design item, not an operating fix. Chemical attack from HF above 5 ppm or phosphoric acid vapor cannot be engineered around at the filter — it must be addressed upstream. None of these is a defect in the filter element; all three are specification issues. That is why our proposals always ask for your worst-case conditions, not your average ones.
Verification You Can Ask For
Production runs under an ISO 9001:2015 certified quality system, and the test data behind these figures is batch-recorded and traceable to raw material lots. For any order you may request: batch dimensional inspection records (±2 mm outside diameter, ±20 mm overall length), filtration performance sampling reports, material certificates, and CE documentation. Third-party inspection (SGS, BV, TÜV) before shipment is welcome at your arrangement. If a number on this page matters to your permit or your process guarantee, ask us for the underlying test report — we would rather show you the data than ask you to trust the brochure.
Frequently Asked Questions — Performance Data
→ See Non-Catalyst Ceramic Fiber Filter and Catalytic Ceramic Fiber Filter for full technical specifications.
Measured Performance in Operating Plants
The figures below are measured inlet and outlet values from operating installations using our ceramic fiber filter elements — not laboratory projections. Customer names are withheld under confidentiality agreements; industry, gas volume and measured concentrations are as recorded on site.
| Plant type | Gas volume | Filters | Temperature | NOx in → out | SO₂ in → out | Dust in → out |
|---|---|---|---|---|---|---|
| Float glass furnace, low-temperature DeNOx (Sichuan, China) | 45,000 m³/h | 600 pcs | 250 → 220°C | 3,364 → 11 mg/m³ | 168 → 6 mg/m³ | 865 → 4 mg/m³ |
| Glass furnace, mid-temperature DeNOx (Anhui, China) | 120,000 m³/h | 1,500 pcs | 370 → 350°C | 2,554 → 36 mg/m³ | 1,050 → 35 mg/m³ | 967 → 4 mg/m³ |
| Marine diesel engine test rig (Shanghai, China) | 7,289 m³/h | 30 pcs | 164 → 216°C | 3,045 → 80 mg/m³ | — | 15.7 → 2.2 mg/m³ |
| Waste incineration, dioxin destruction (export project) | — | — | 170–300°C window | — | — | Dioxin destruction up to 99.5% TEQ |
The catalytic grade works in a 170–300°C window (optimum 220–260°C): roughly 90% DeNOx at 200°C with the low-temperature formulation and about 98% at 280°C, with dioxin destruction by selective catalytic oxidation inside the same tube wall. Full project references are available under NDA — request the reference list.
Calculating the Specific Filter Area Load
The specific filter area load — often called face velocity — is the operating gas flow divided by the total effective filter area: v = Q / A. For a candle-type element, the effective area of one tube is Atube = π × OD × Leff, where OD is the outer diameter and Leff the effective filtration length. Worked through as variables: for a gas flow of Q m³/h at a design face velocity of v m/min, the required area is A = Q / (60 × v), and the element count is N = A / Atube, rounded up. Insert the numbers from your own gas measurement; the full six-step sizing sequence is in the ceramic filter element selection guide.
 English
  Deutsch
  简体中文
简体中文  한국어
한국어  日本語
日本語  Español
  Français
  Italiano
  Türkçe
  Tiếng Việt
  Português
  हिन्दी
  العربية
  Polski
  繁體中文
繁體中文